Specialist Practice Questions – Additional Questions for Sharing Insights 오답 노트
- 본 포스팅은 유데미의 Tableau Desktop Specialist Certification Prep 강의 중 섹션 6: Sharing Insights의 Additional Questions for Sharing Insights의 내용을 토대로 작성되었음을 밝힙니다. 보다 정확한 내용은 아래 링크를 참고하세요.
https://www.udemy.com/course/tableau-specialist-certification-prep/
정답률 75% (9개/12개)
보라색 글자는 Tableau Desktop에서 실습해보거나, 추가 검색/정리 등 정확한 확인이 필요한 부분입니다.
1. 틀린 문제
Question 1 [3.1.1 Use color from the marks card] How do you change the color of a chart from Marks card in Tableau? – [Select all that Apply]
a) For an existing chart select the All in Marks card -> Select Color -> Edit Colors -> From the Select Color Palette select any of the desired option -> From the select Data item choose desired color for each of the measure -> Apply -> Ok
b) For an existing chart select the All in Marks card -> From the Select Color Palette select any of the desired option -> From the select Data item choose desired color for each of the measure -> Apply -> Ok
c) For an existing chart select the All in Marks card -> Select Color -> Edit Colors -> From the Select Color Palette select any of the desired option -> Apply -> Ok
d) For an existing chart select the All in Marks card -> Select Color -> Choose the desired color -> Apply -> Ok
Correct answer: a, c.
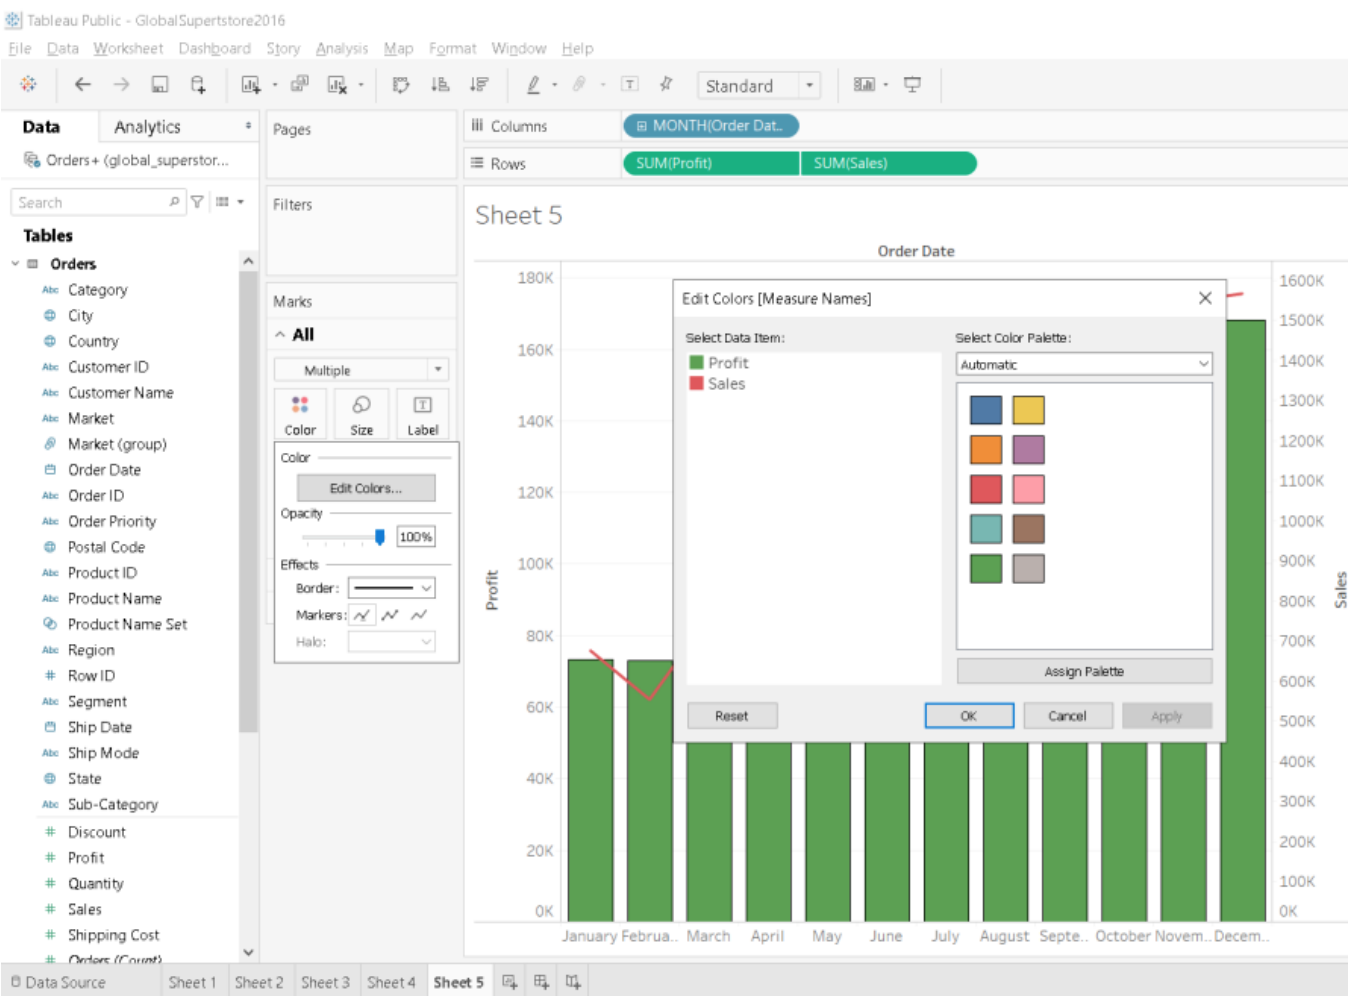
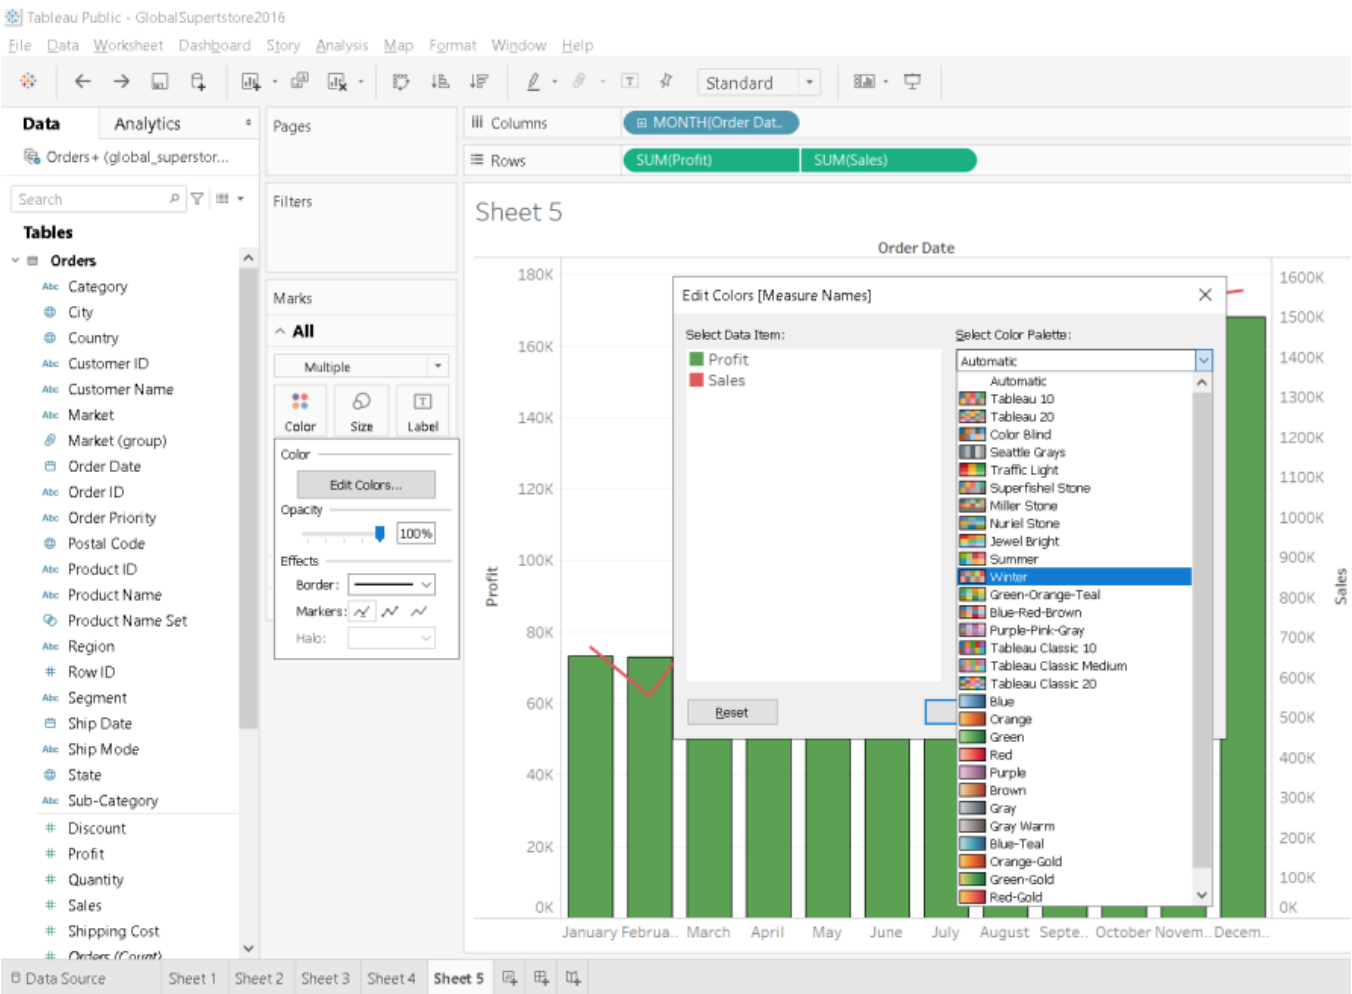
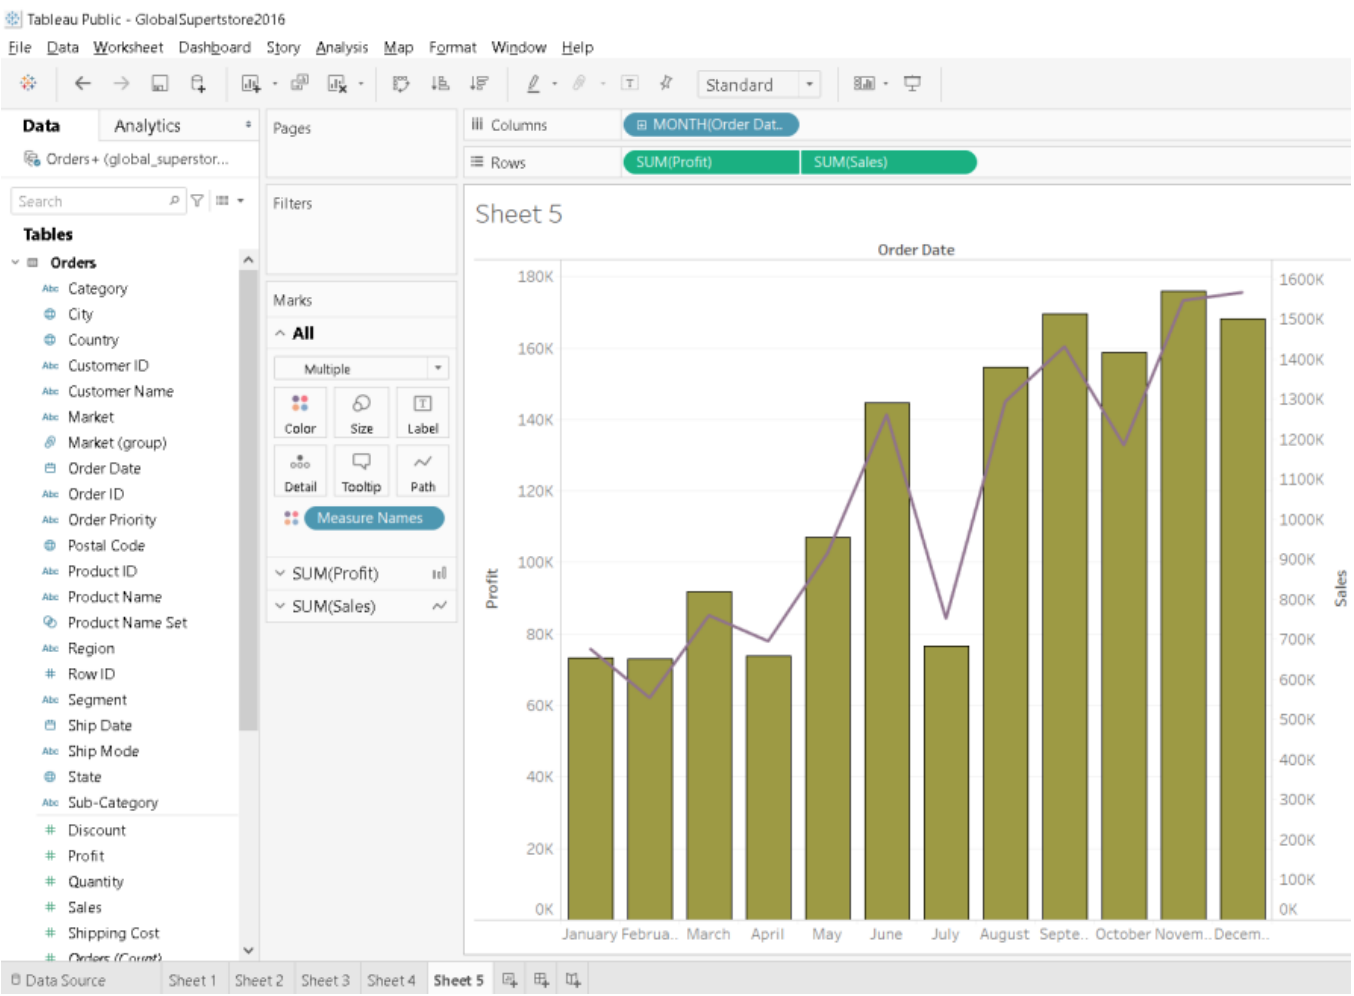
Explanation: There are two ways to change color from Marks card – For an existing chart select the All in Marks card -> Select Color -> Edit Colors -> From the Select Color Palette select any of the desired option -> From the select Data item choose desired color for each of the measure -> Apply -> Ok
Or For an existing chart select the All in Marks card -> Select Color -> Edit Colors -> From the Select Color Palette select any of the desired option -> Apply -> Ok (when we are keeping the color palette as automatic) Step 1: Choose color for All from Marks Card

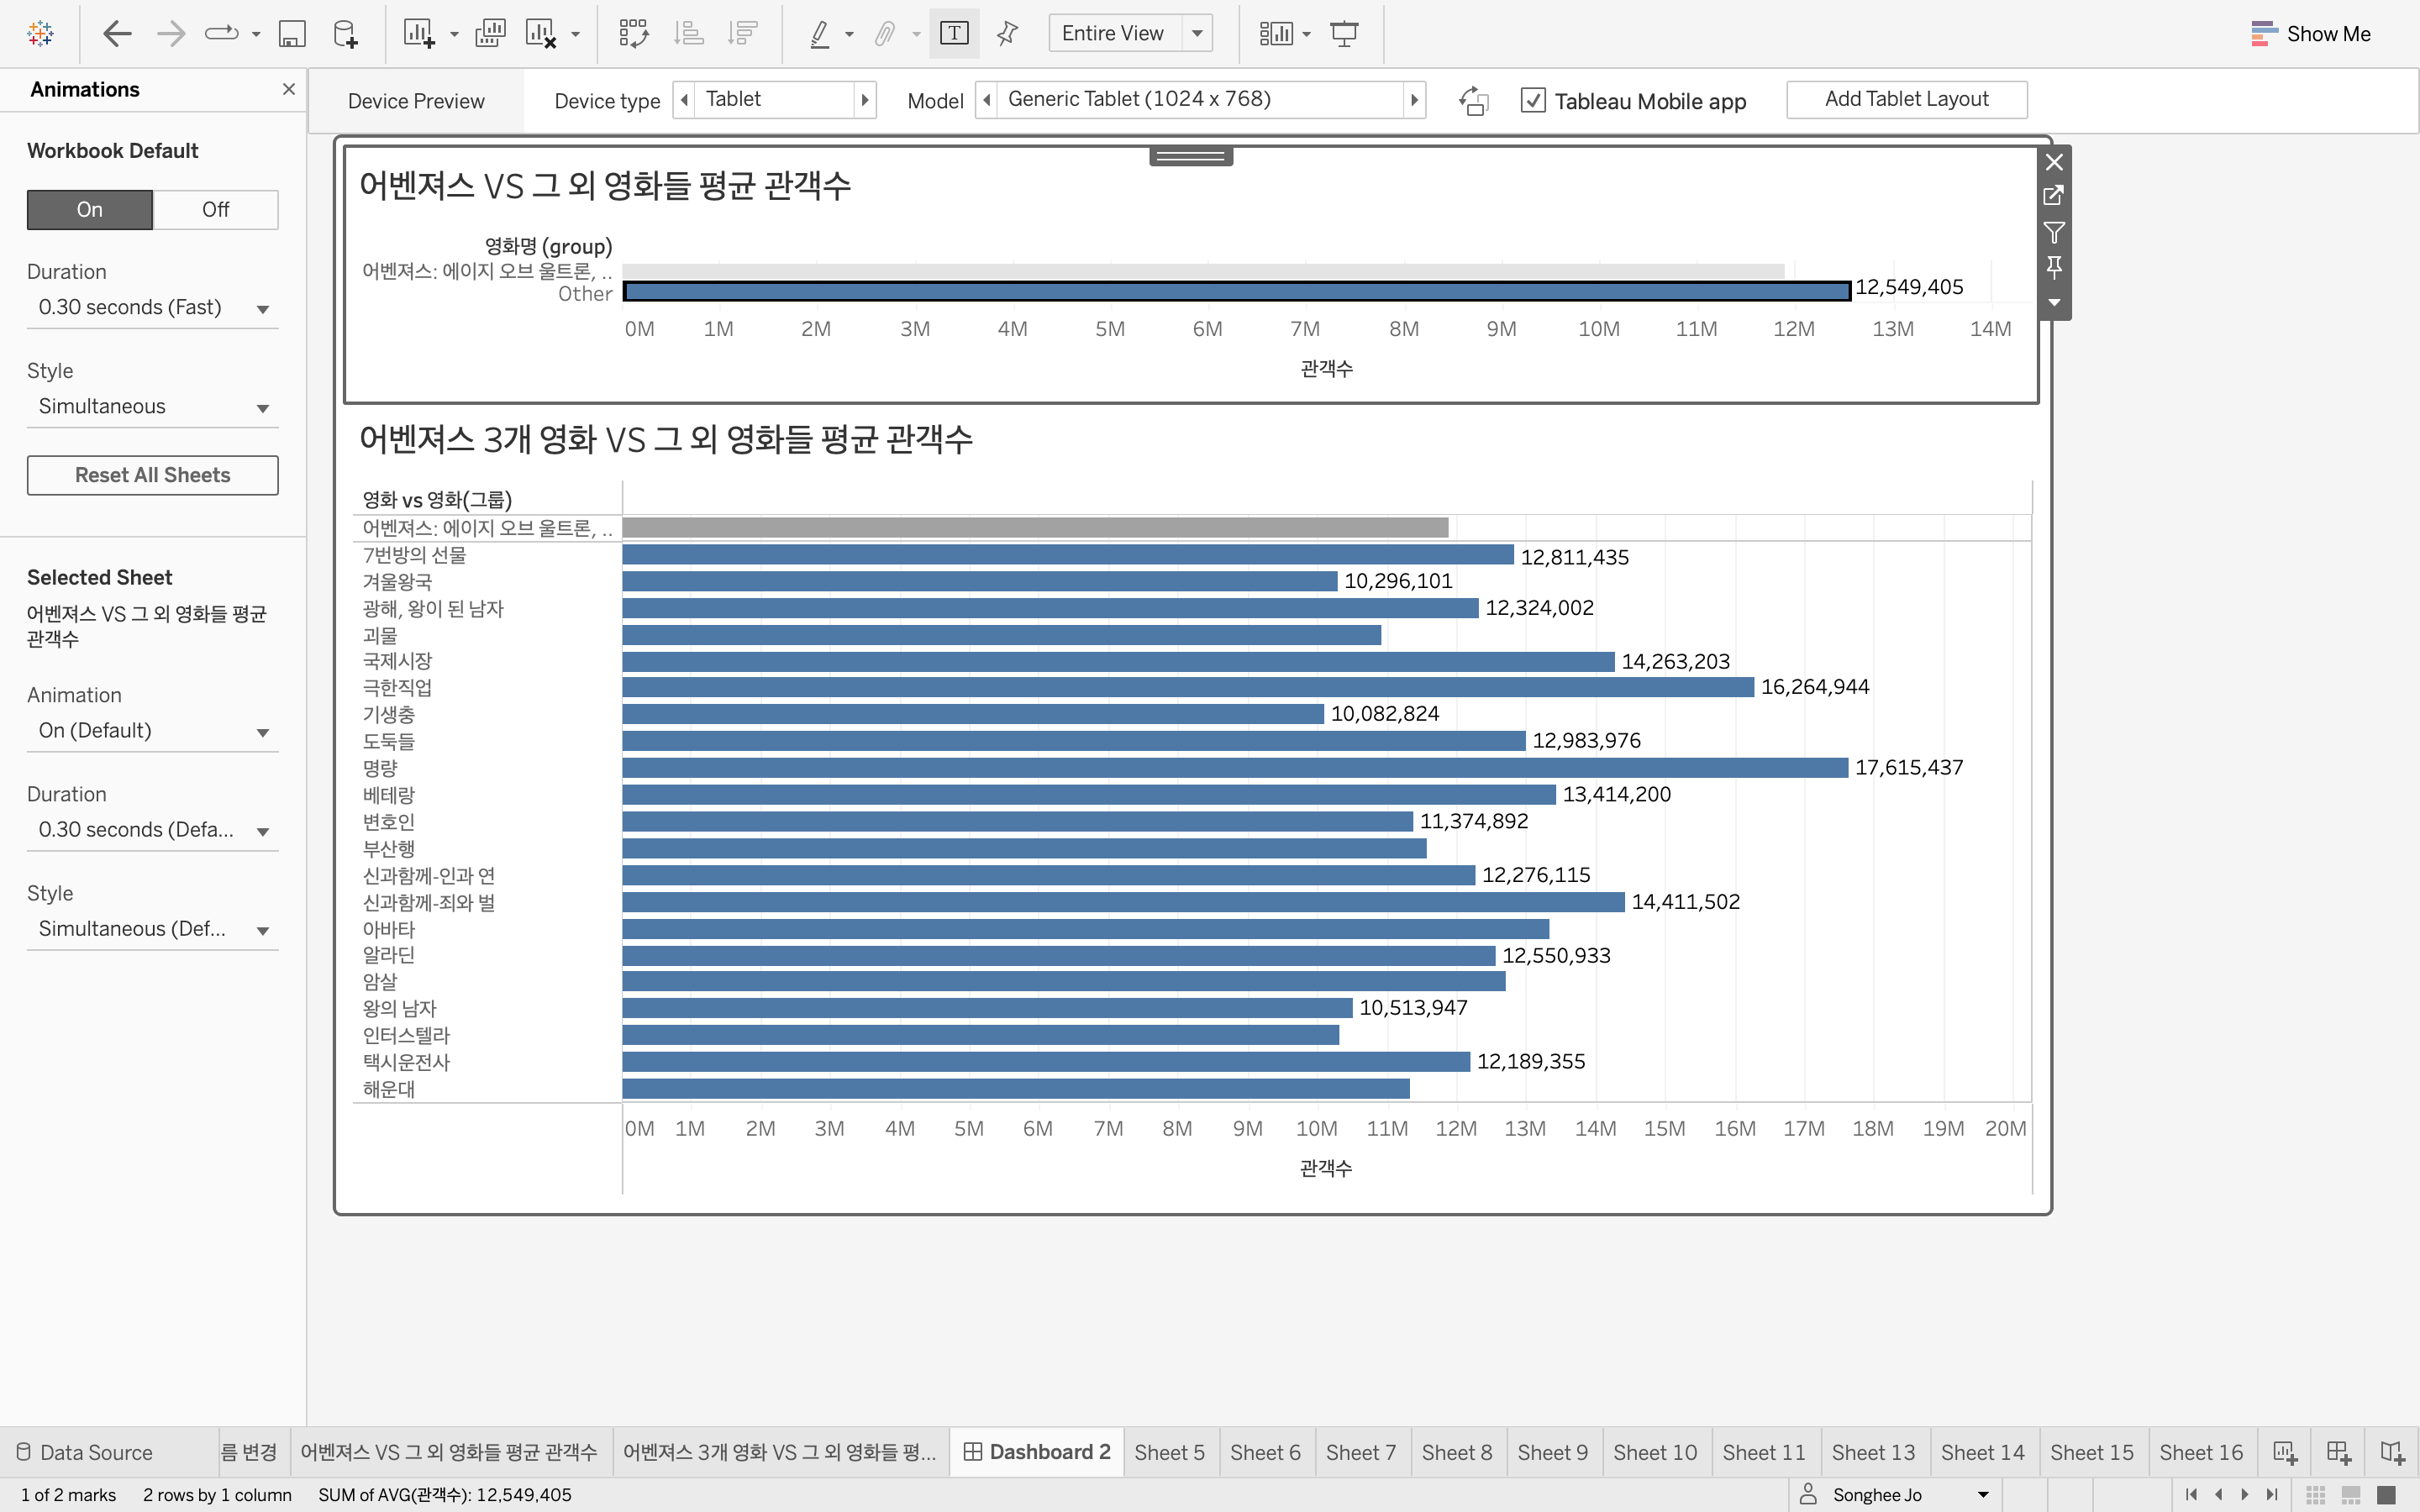
Question 4 [3.1.4 Configure viz animations] How can we enable the option of Animation in Tableau?
a) Go to Analysis -> Choose Animations -> Select On from Animations Tab
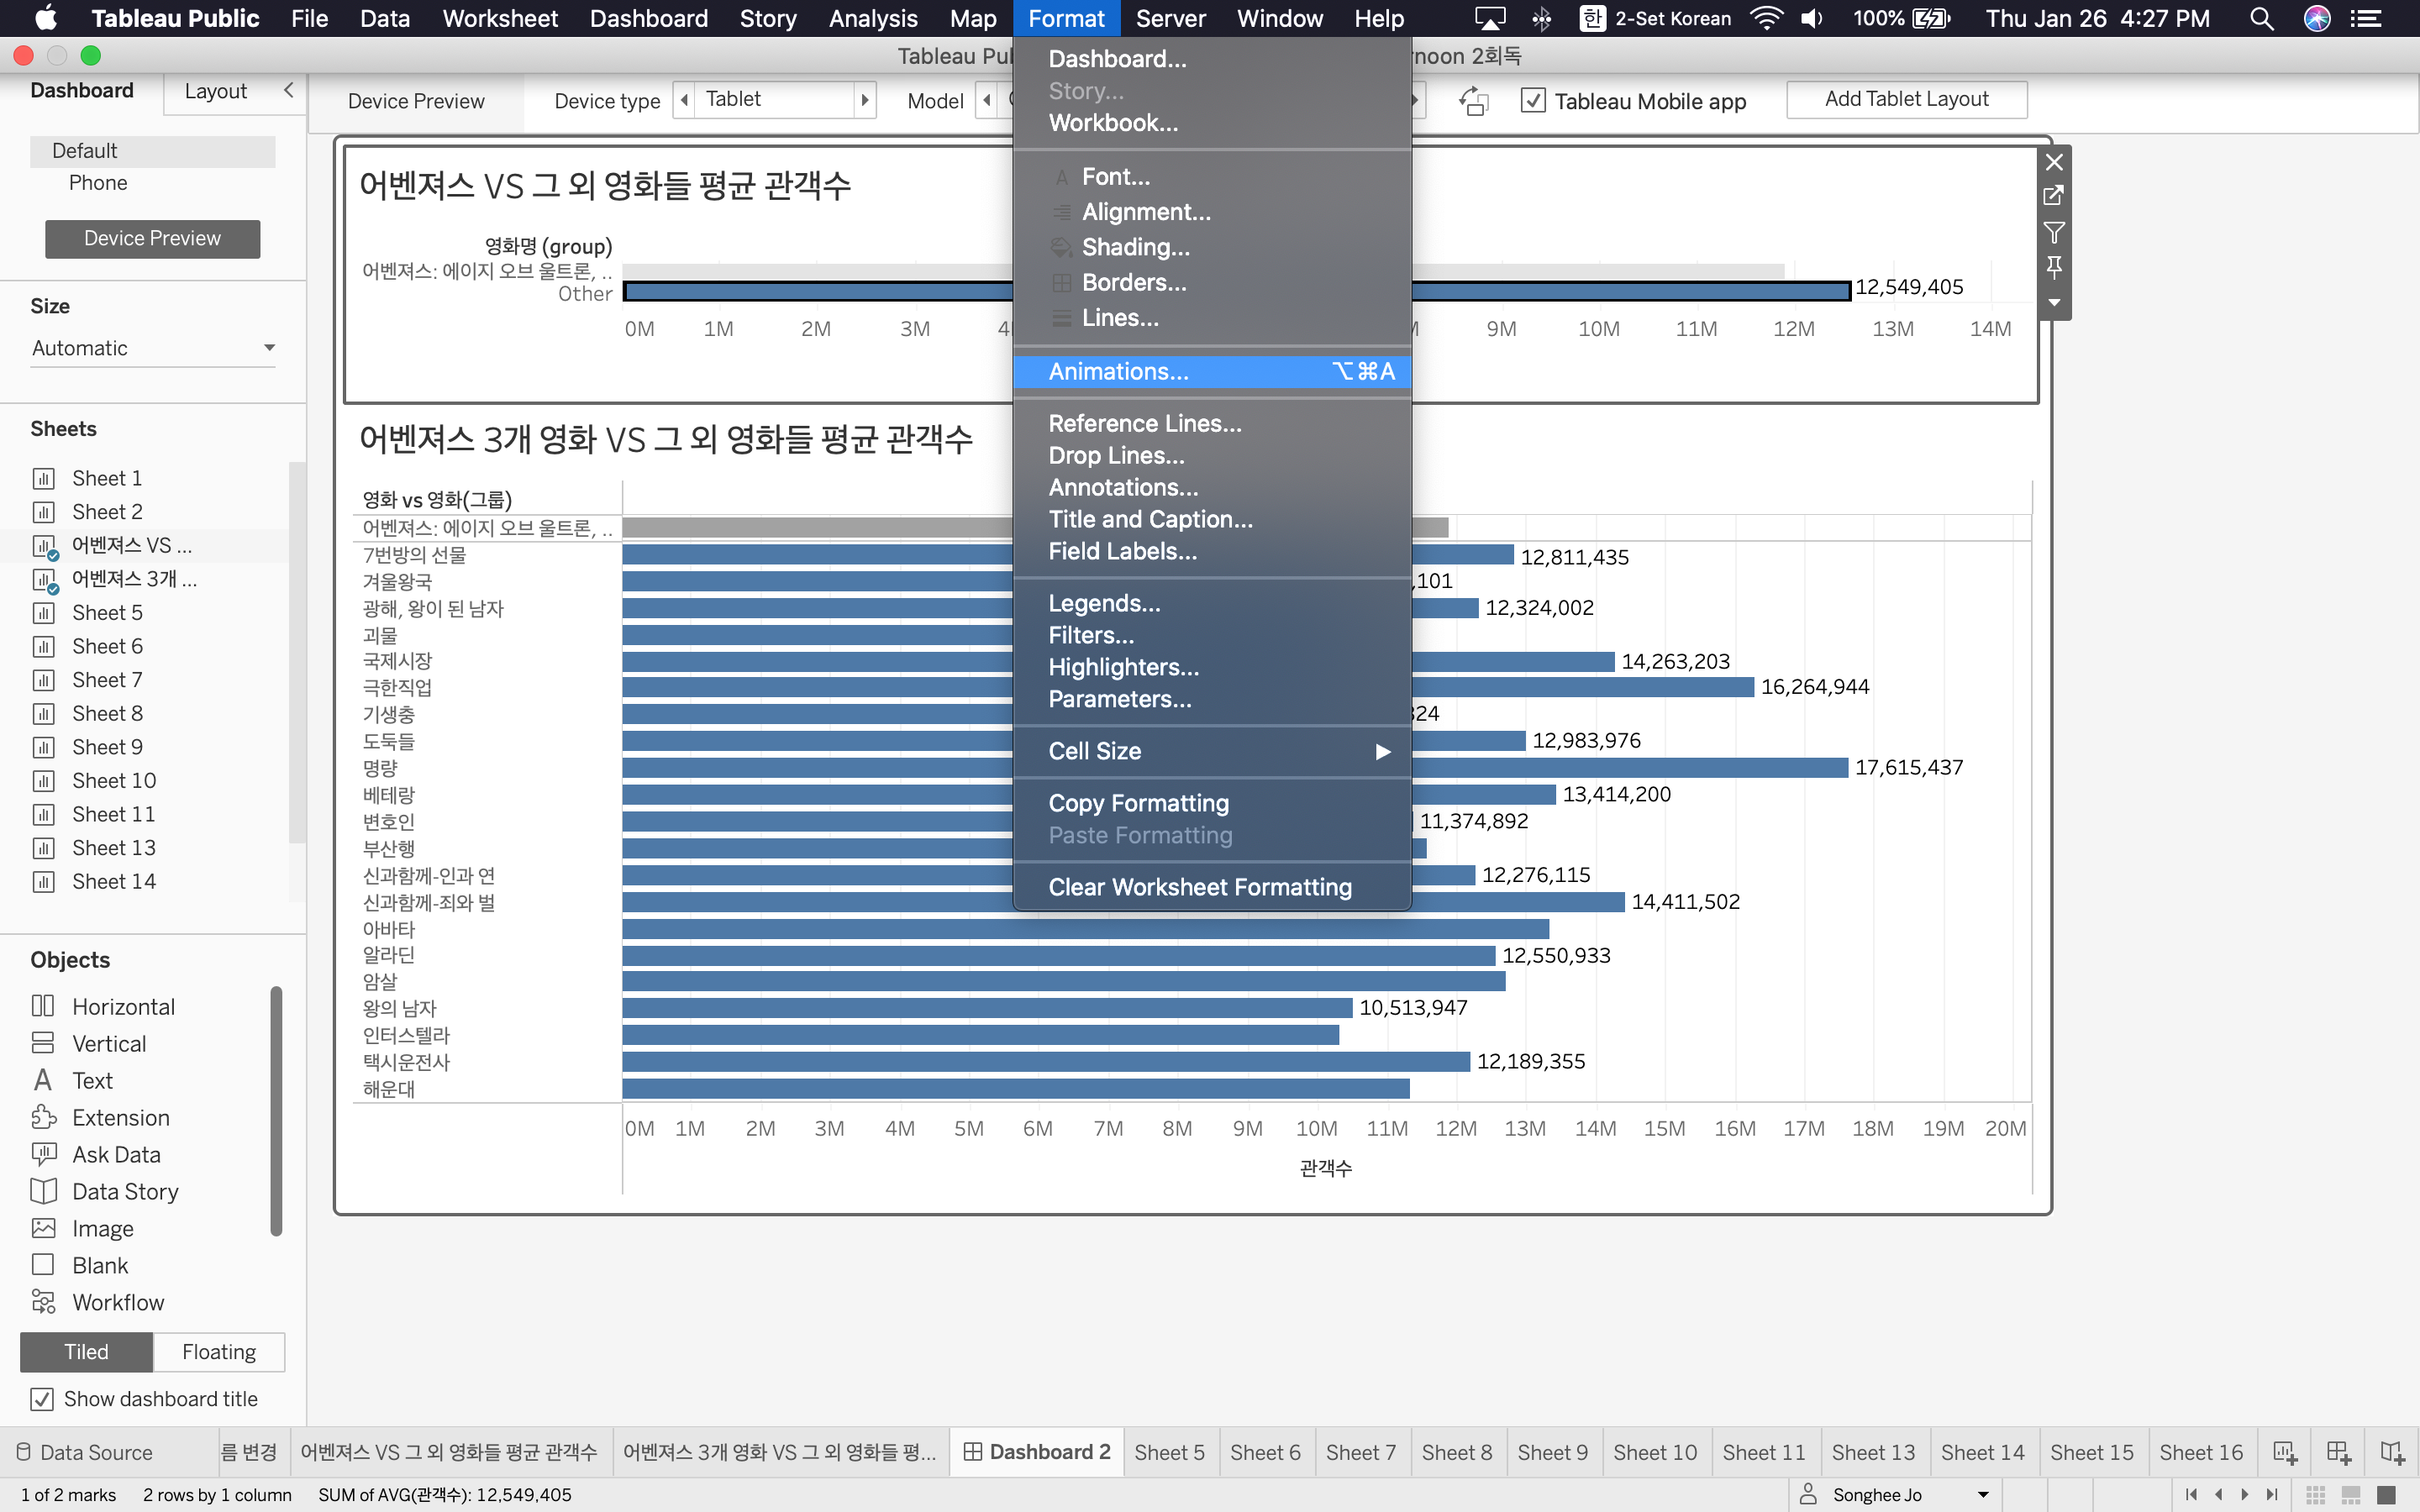
b) Go to Format -> Choose Animations -> Select On from Animations Tab
c) Go to Dashboard -> Choose Animations -> Select On from Animations Tab
d) Go to Worksheet -> Choose Animations -> Select On from Animations Tab
Correct answer: b.
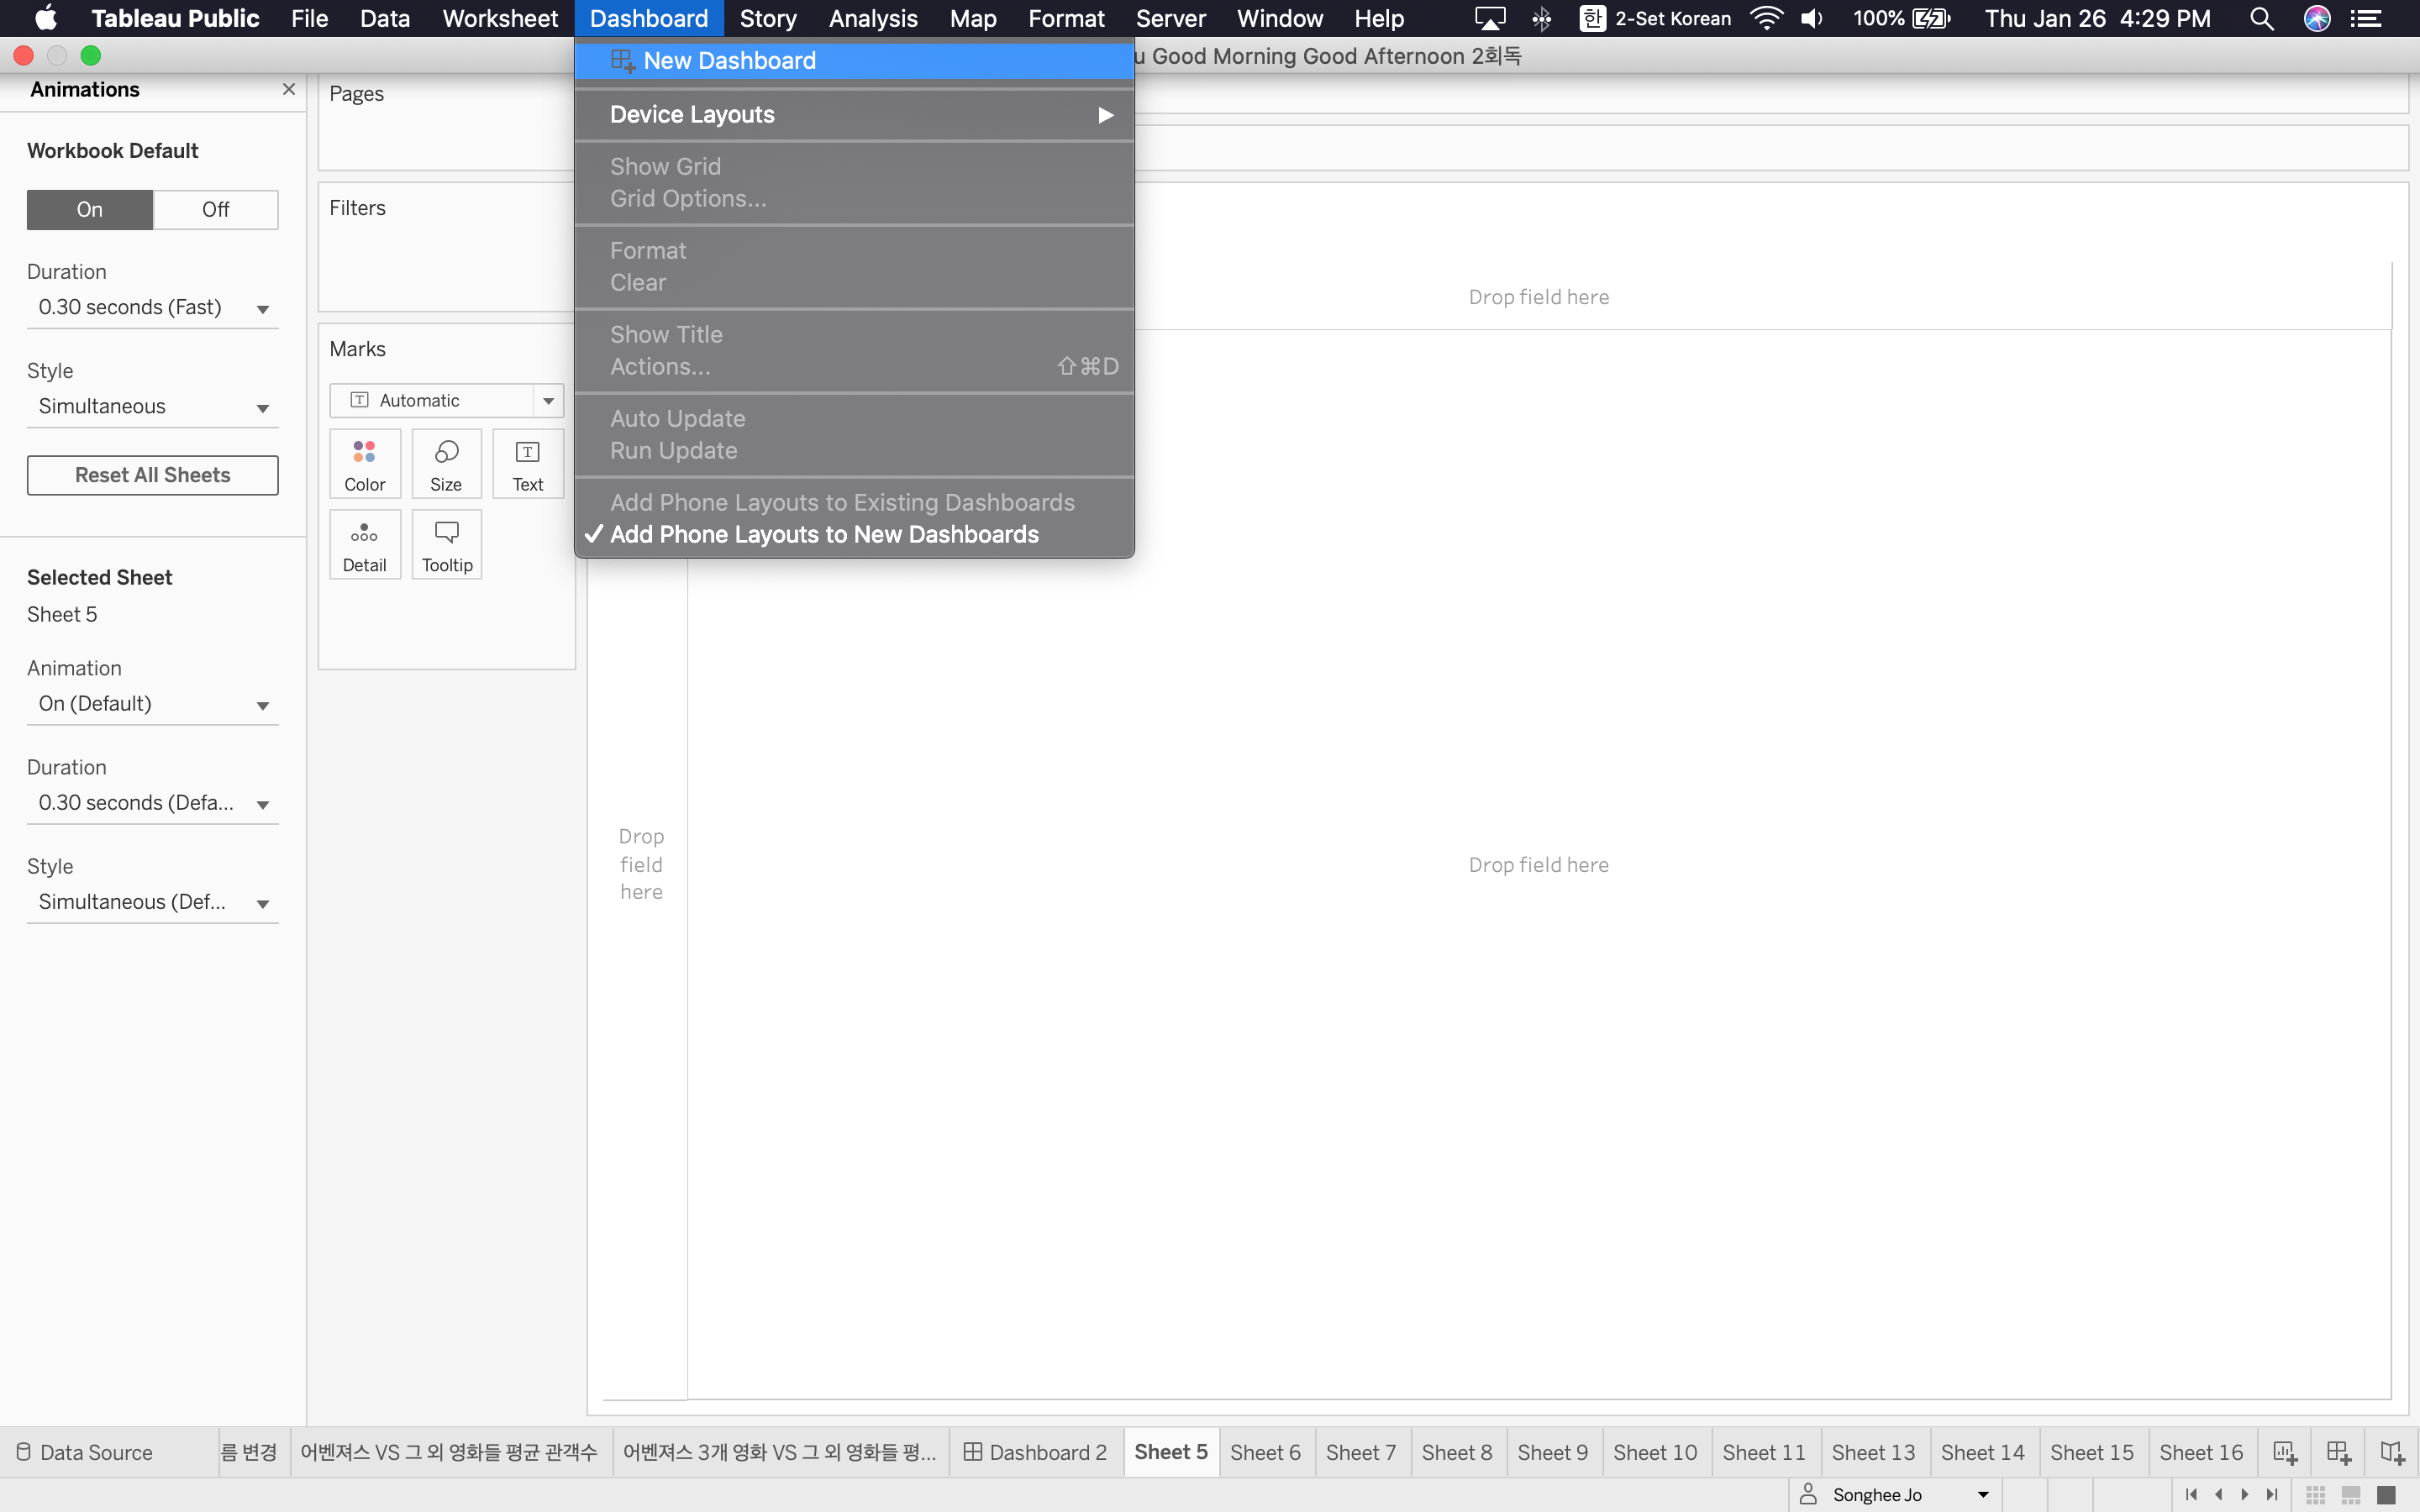
Question 6 [3.2.1 Add worksheets to a dashboard] How can we create a dashboard in Tableau? [Select all that Apply]
a) Go to dashboard and select New Dashboard -> Drag the desired worksheets to the dashboard to work for -> Adjust the dashboard length and width -> Ok
b) Go to Analysis and select New Dashboard -> Drag the desired worksheets to the dashboard to work for -> Adjust the dashboard length and width -> Ok
c) Go to Worksheets and select New Dashboard -> Drag the desired worksheets to the dashboard to work for -> Adjust the dashboard length and width -> Ok
d) Select the New Dashboard option -> Drag the desired worksheets to the dashboard to work for -> Adjust the dashboard length and width -> Ok
Correct answer: a, d.

2. 확인&복습할 문제
Question 2 [3.1.2 Configure fonts] Choose which of the following are true for using fonts in Tableau for visualization? – [Select all that Apply]
a) If the workbook is created in Tableau Desktop then we can use any font installed on the computer in the workbook. b) If the workbook is created using Web Authoring we can use any font installed on the computer in the workbook
c) If the workbook is published to Tableau Server any custom font must be installed on all server nodes. If the font is not installed on Tableau Server, the uninstall font will be replaced with a substitute font upon publishing.
d) If the workbook is published to Tableau Online we can use any font installed on the computer in the workbook.
Correct answer: a, c.
Explanation: If the workbook is created using Web Authoring we can use only fonts installed on the Tableau Server or Tableau Online are functional when formatting your text. If the workbook is published to Tableau Online we can use only fonts supported by Tableau Online will appear.
Authoring - 저작(프로그래밍 언어를 사용하지 않고 프로그램을 제작하는 것)
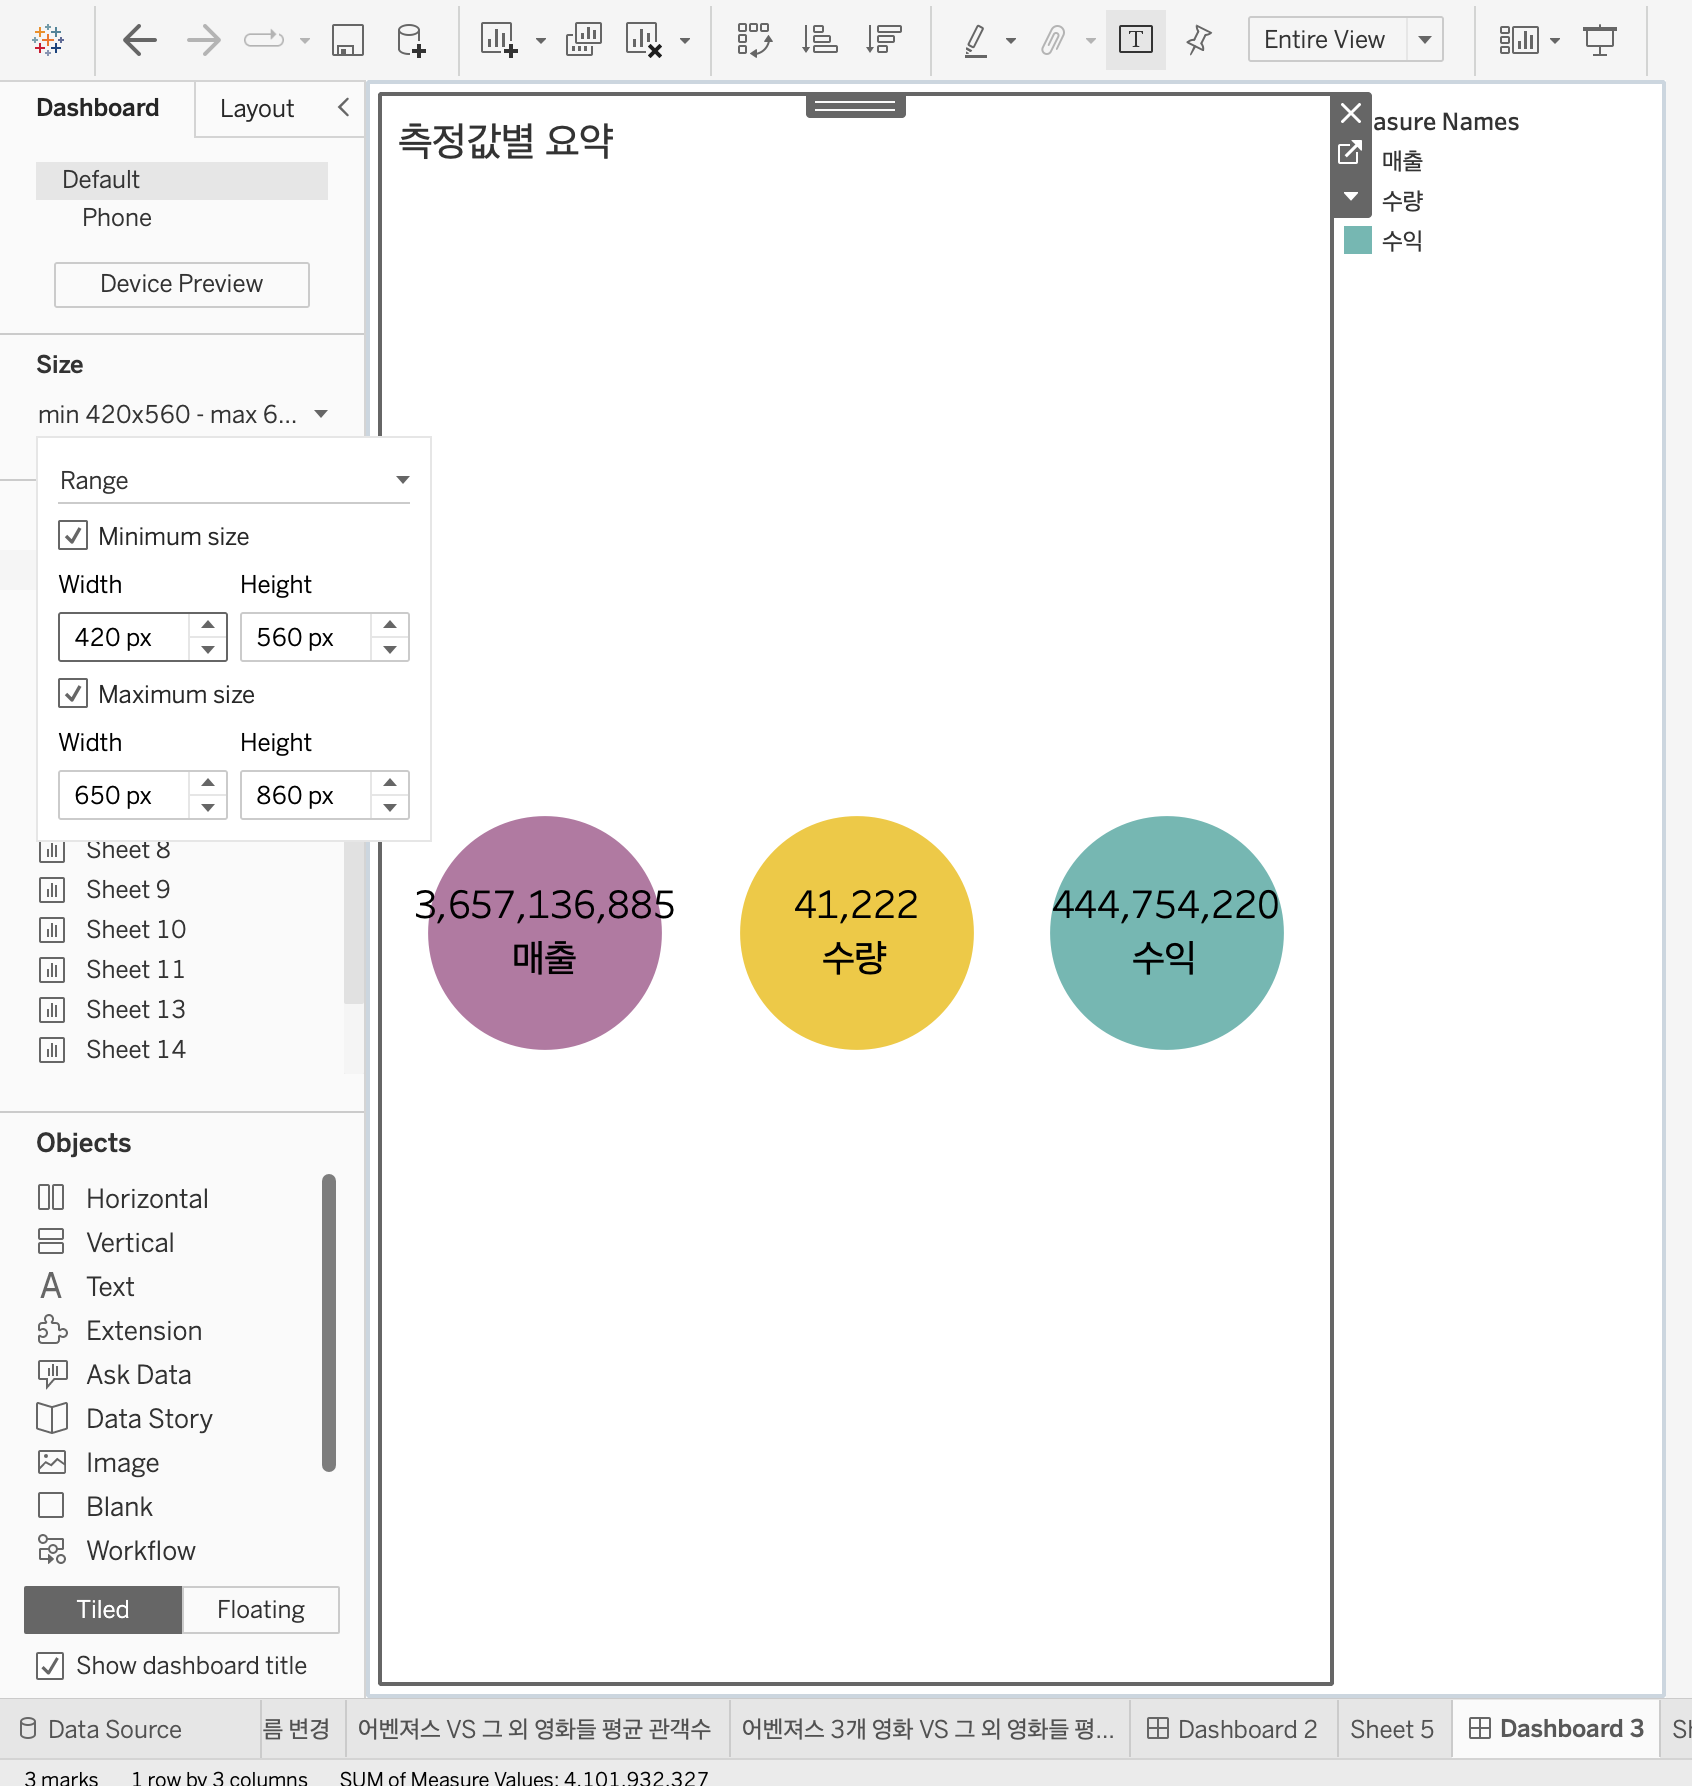
Question 3 [3.1.3 Format marks as shapes] How can we change the shape of the marks for a chart in Tableau?
a) Choose any two measures and drag them to columns and rows -> select any measure and drag it to the color of Marks card -> select any measure and drag it to the shape of the Marks card
b) Choose any one measures and drag it to columns and choose any dimension and drag it to rows -> select any dimension and drag it to the color of Marks card -> select any dimension/measure and drag it to the shape of the Marks card
c) Choose any two dimensions and drag them to columns and rows -> select any dimension and drag it to the color of Marks card -> select any dimension/measure and drag it to the shape of the Marks card
d) Choose any two measures and drag them to columns and rows -> select any dimension and drag it to the color of Marks card -> select any dimension/measure and drag it to the shape of the Marks card
Correct answer: d.
Explanation: The correct way to change the shape of the marks for a chart in Tableau – Choose any two measures and drag them to columns and rows -> select any dimension and drag it to the color of Marks card -> select any dimension/measure and drag it to the shape of the Marks card


Question 7 [3.2.2 Add interactive elements for consumers (e.g. show filters, data highlighter, tooltips)] How do you create a viz in tooltip in Tableau?
a) Create a visualization in the source worksheet in Tableau -> Create a visualization in a target worksheet view to serve as the Viz in Tooltip and rename it to identify -> In the source worksheet, click Tooltip in the Marks card -> Select insert and select the target worksheet
b) Create a visualization in the source worksheet in Tableau -> Create a visualization in a target worksheet view to serve as the Viz in Tooltip and rename it to identify -> In the target worksheet, click Tooltip in the Marks card -> Select insert and select the target worksheet
c) Create a visualization in the source worksheet in Tableau -> Create a visualization in a target worksheet view to serve as the Viz in Tooltip and rename it to identify -> In the source worksheet, click Tooltip in the Analytics tab -> Select insert and select the target worksheet
d) Create a visualization in the source worksheet in Tableau -> Create a visualization in a target worksheet view to serve as the Viz in Tooltip and rename it to identify -> In the source worksheet, click Tooltip in the Worksheets tab -> Select insert and select the target worksheet
Correct answer: a.

Question 8 [3.2.3 Add dashboard actions (e.g. filter action, highlight action, parameter control, URL action)] Which of the following are true for URL actions in Tableau? [Select all that apply]
a) A URL action is a hyperlink that points to a web page, file, or other web-based resource outside of Tableau
b) We can use URL actions to create an email
c) We can use URL actions to link to additional information about the data
d) To customize links based on our data, we cannot automatically enter / field values / as parameters (in URLs.)
parameter - 매개 변수
Correct answer: a, b, c.
Explanation: For URL actions in Tableau to customize links based on your data, you can automatically enter field values as parameters in URLs. Also, URL action is a hyperlink that points to a web page, file, or other web-based resource outside of Tableau. We can use URL actions to create an email or link to additional information about our data.

Question 9 [3.2.4 Configure a dashboard layout and create device-specific dashboards] How can we manually add separate device layout in Tableau?
a) Open a dashboard -> On the Dashboard tab on the left, click Device Preview -> Take a moment to click through the Device types and Models and explore the different screen sizes ->Also there is a button to turn the dashboard into landscape or portrait mode
b) Open a dashboard -> On the Analytics tab on the left, click Device Preview -> Take a moment to click through the Device types and Models and explore the different screen sizes ->Also there is a button to turn the dashboard into landscape or portrait mode
c) Open a Worksheet -> On the Dashboard tab on the left, click Device Preview -> Take a moment to click through the Device types and Models and explore the different screen sizes ->Also there is a button to turn the dashboard into landscape or portrait mode
d) Open a dashboard -> On the Dashboard click on Format tab and select Device Preview -> Take a moment to click through the Device types and Models and explore the different screen sizes ->Also there is a button to turn the dashboard into landscape or portrait mode
Correct answer: a.


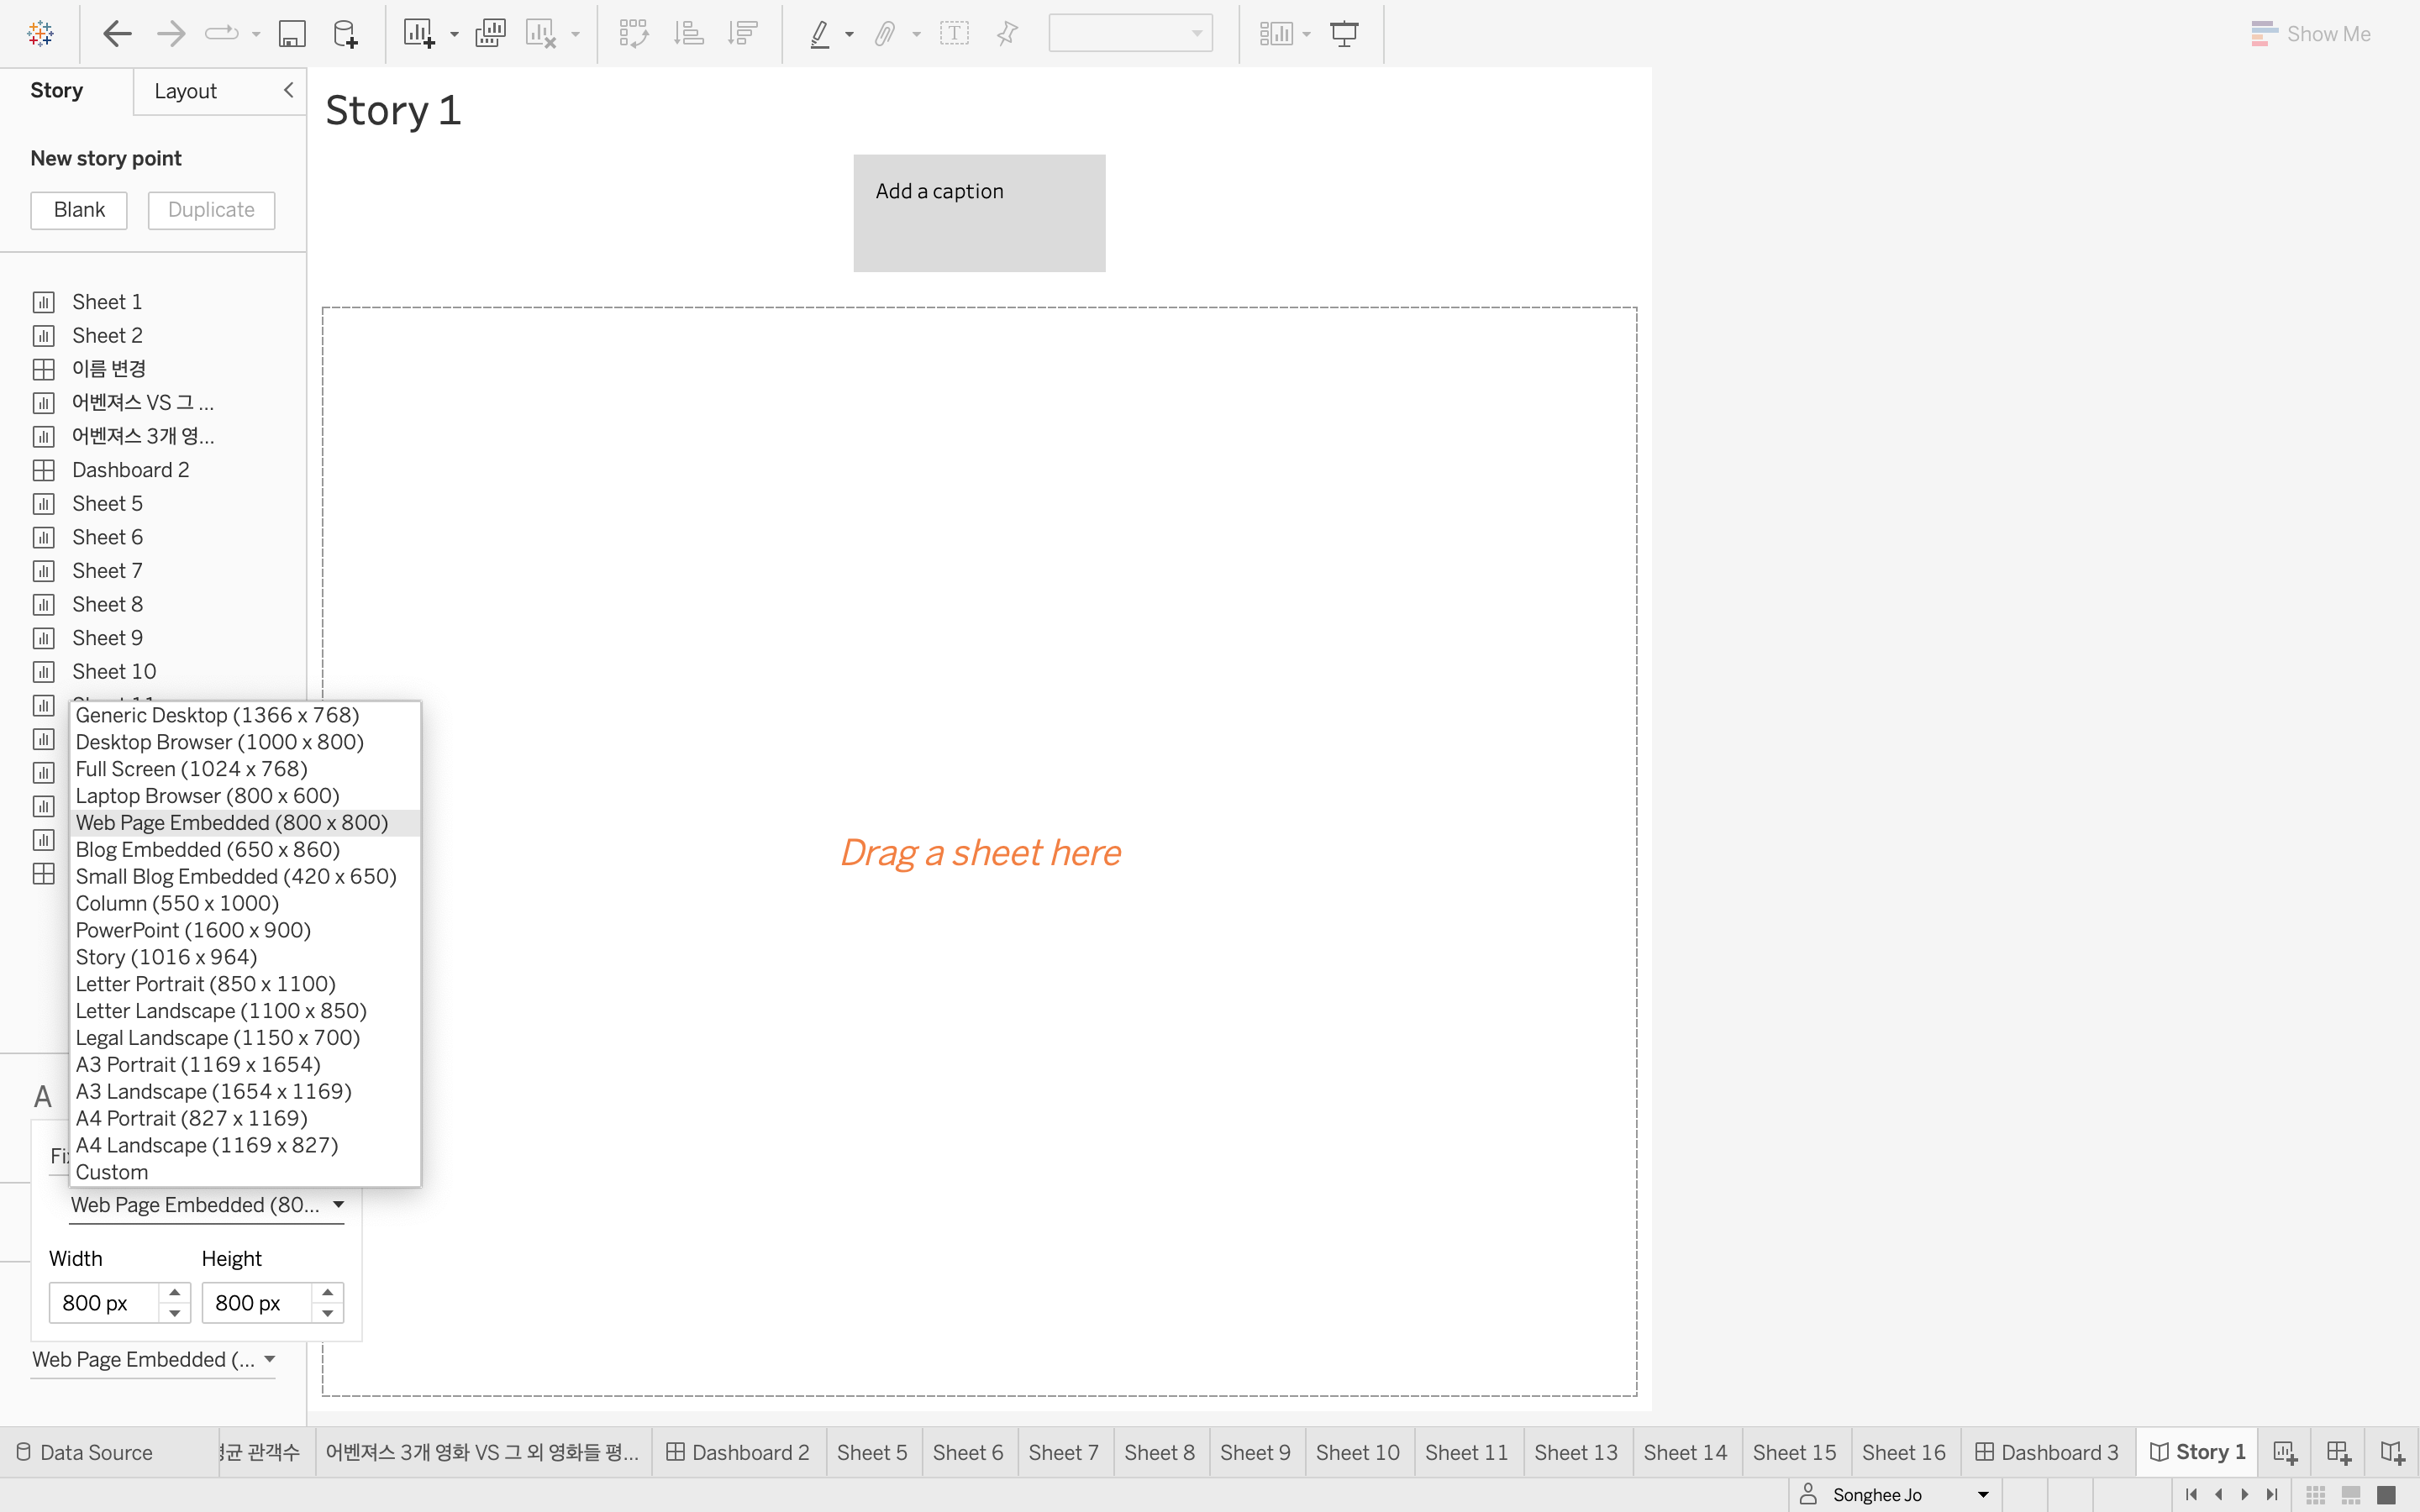
Question 10 [3.2.5 Create a story and a story point] How can we create a story in Tableau?
a) Go to Analysis -> Click on New Story -> Select Ok
b) Go to File -> Click on New Story -> Select Ok
c) Click the New Story tab -> In the lower-left corner of the screen, choose a size for the story -> Double click on any sheet or dashboard to put inside the story -> By default the story name gets its title from the (단어가 없다... sheet/dashboard겠지요 아마) -> Click Add a caption to summarize the story point.
d) Go to Data -> Click on New Story -> Select Ok Correct answer: c. Explanation: To create a story in Tableau we need to follow the below steps
Correct answer: c.
Explanation: To create a story in Tableau we need to follow the steps of c.


Question 12 [3.3.3 Export to Microsoft PowerPoint] How can we export a view as an image file in Tableau?
a) Select Data > Export> Image -> Click Save -> In the Save Image dialog box, specify a file location, name, and format. Then click Save
b) Select Worksheet > Export> Image -> In the Export Image dialog box, select the elements we want to include in the image. If the view contains a legend, under Image Options, select the legend layout -> Click Save -> In the Save Image dialog box, specify a file location, name, and format. Then click Save
c) Select Format > Export> Image -> Click Save -> In the Save Image dialog box, specify a file location, name, and format. Then click Save
d) Select Worksheet -> Click Save as -> In the Save Image dialog box, specify a file location, name, and format. Then click Save
Public에서는 Export 이하 옵션이 뜨지 않는다!
Correct answer: b.
Explanation: To export a view as an image file in Tableau we need to follow the below steps – Select Worksheet then select Export and then select Image. In the Export Image dialog box, select the elements we want to include in the image. If the view contains a legend, under Image Options, select the legend layout. Then click Save and in the Save Image dialog box, specify a file location, name, and format. Then click Save.